
Elliott Wave Theory: A Controversial Market Forecasting Tool
The Elliott Wave Theory is a form of technical analysis used to forecast future price movements by identifying patterns in investor psychology, highs, and lows. Developed by Ralph Nelson Elliott in the 1930s, it proposes that market prices move in specific patterns called waves. These waves are thought to reflect the collective psychology of investors, oscillating between optimism and pessimism.
Understanding the Waves
The theory identifies two main types of waves:
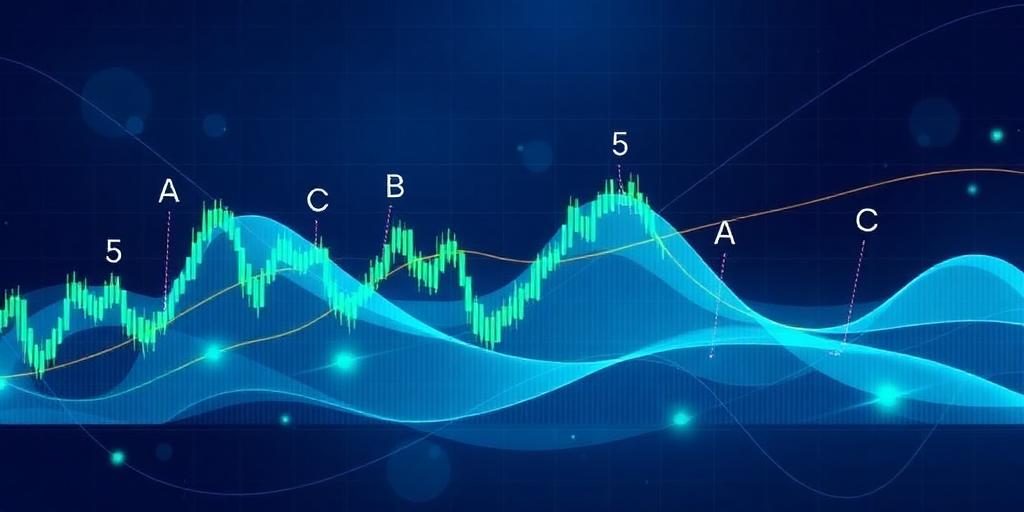
- Motive Waves: These waves move in the direction of the main trend and consist of five sub-waves. Each motive wave is labeled with numbers 1 through 5.
- Corrective Waves: These waves move against the main trend and consist of three sub-waves, labeled A, B, and C.
According to Elliott, these patterns are fractal, meaning they occur on both small and large scales. A complete Elliott Wave cycle consists of eight waves: five motive waves followed by three corrective waves. The motive waves are numbered 1-5, and the corrective waves are labeled A-B-C.
Core Principles of the Elliott Wave Theory
The Elliott Wave Theory is built on several key principles:
- Wave Patterns: Markets move in predictable patterns consisting of motive and corrective waves.
- Fractal Nature: Wave patterns repeat themselves on different scales, from minutes to decades.
- Fibonacci Ratios: Fibonacci ratios are used to determine potential support and resistance levels, as well as the magnitude of wave movements.
Fibonacci Ratios and Elliott Waves
Fibonacci ratios, derived from the Fibonacci sequence, play a significant role in Elliott Wave analysis. Common ratios such as 61.8%, 38.2%, and 23.6% are used to identify potential levels where waves might begin or end. For example, a corrective wave might retrace 61.8% of the previous motive wave.
How to Apply Elliott Wave Theory
Applying the Elliott Wave Theory involves identifying wave patterns on price charts. This process requires careful observation and interpretation. Here are the general steps:
- Identify the Main Trend: Determine the primary direction of the market.
- Label the Waves: Label the motive and corrective waves according to the Elliott Wave pattern.
- Use Fibonacci Ratios: Apply Fibonacci ratios to estimate the potential extent of each wave.
- Confirm with Other Indicators: Use other technical indicators to confirm the Elliott Wave analysis.
Criticisms and Limitations
Despite its popularity, the Elliott Wave Theory is controversial and subject to criticism:
- Subjectivity: Identifying wave patterns can be subjective, leading to different interpretations among analysts.
- Complexity: The theory can be complex and difficult to apply consistently.
- Uncertainty: Elliott Wave analysis is not always accurate, and markets do not always follow predicted patterns.
Conclusion
The Elliott Wave Theory is a unique approach to technical analysis that attempts to forecast market movements based on recurring wave patterns and investor psychology. While it offers a structured way to view market trends, its subjective nature and complexity mean it should be used with caution and in conjunction with other analysis tools. Despite the criticisms, many traders find value in its ability to provide context to market movements and potential future trends.


