
Candlestick charts are a visual representation of price movements in a market, providing traders with insights into market sentiment. Each candlestick represents the price action for a specific period, displaying the opening, closing, high, and low prices. Understanding these charts is essential for anyone involved in trading or investment.
Understanding Candlestick Components
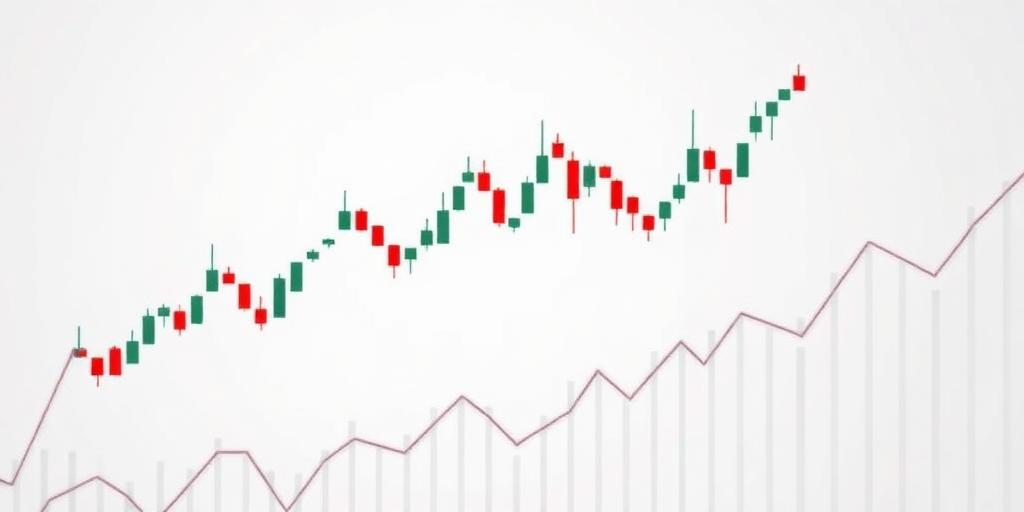
- Body: The body of the candlestick represents the range between the opening and closing prices. A hollow or green body indicates that the closing price was higher than the opening price (bullish), while a filled or red body indicates the opposite (bearish).
- Wicks/Shadows: The wicks, also known as shadows, extend above and below the body. The upper wick represents the high price for the period, and the lower wick represents the low price.
Common Candlestick Patterns
- Doji: This pattern forms when the opening and closing prices are nearly equal. It suggests indecision in the market.
- Hammer/Hanging Man: These patterns have small bodies with long lower wicks. A hammer appears in a downtrend and signals a potential reversal, while a hanging man appears in an uptrend and suggests a potential reversal to the downside.
- Engulfing Pattern: This pattern consists of two candlesticks. A bullish engulfing pattern occurs when a green candlestick completely engulfs the previous red candlestick, indicating strong buying pressure. A bearish engulfing pattern occurs when a red candlestick completely engulfs the previous green candlestick, indicating strong selling pressure.
Interpreting Market Sentiment
Candlestick patterns provide valuable insights into market sentiment. For example, long-bodied candlesticks indicate strong buying or selling pressure, while short-bodied candlesticks suggest consolidation or indecision. Analyzing candlestick patterns in conjunction with other technical indicators can improve the accuracy of trading decisions.
Conclusion
Candlestick charting is a powerful tool for understanding market sentiment visually. By understanding the components of candlesticks and recognizing common patterns, traders can gain valuable insights into potential price movements and make more informed trading decisions.


